The sales and revenue reports turn your day-to-day transactions into a clear picture of how the business is doing — what sold, how income is trending, and where your margins really are. They read straight from the invoices and payments you record at the point of sale, so a sale flows into these figures the moment it is rung up. Owners lean on them to track the health of the business, managers to compare one period or store against another, and accountants to reconcile takings against what was invoiced.
Before you start
These reports live under Reports and appear only when the Sales module is switched on for your business. Each report also checks your permissions before it loads — if a report isn't listed for you, ask an owner to grant the matching reporting access. Every figure here is built from invoices and the payments against them; income you enter directly in Banking as "other revenue" is not counted in these reports.
Step 1 — Filter the sales summary
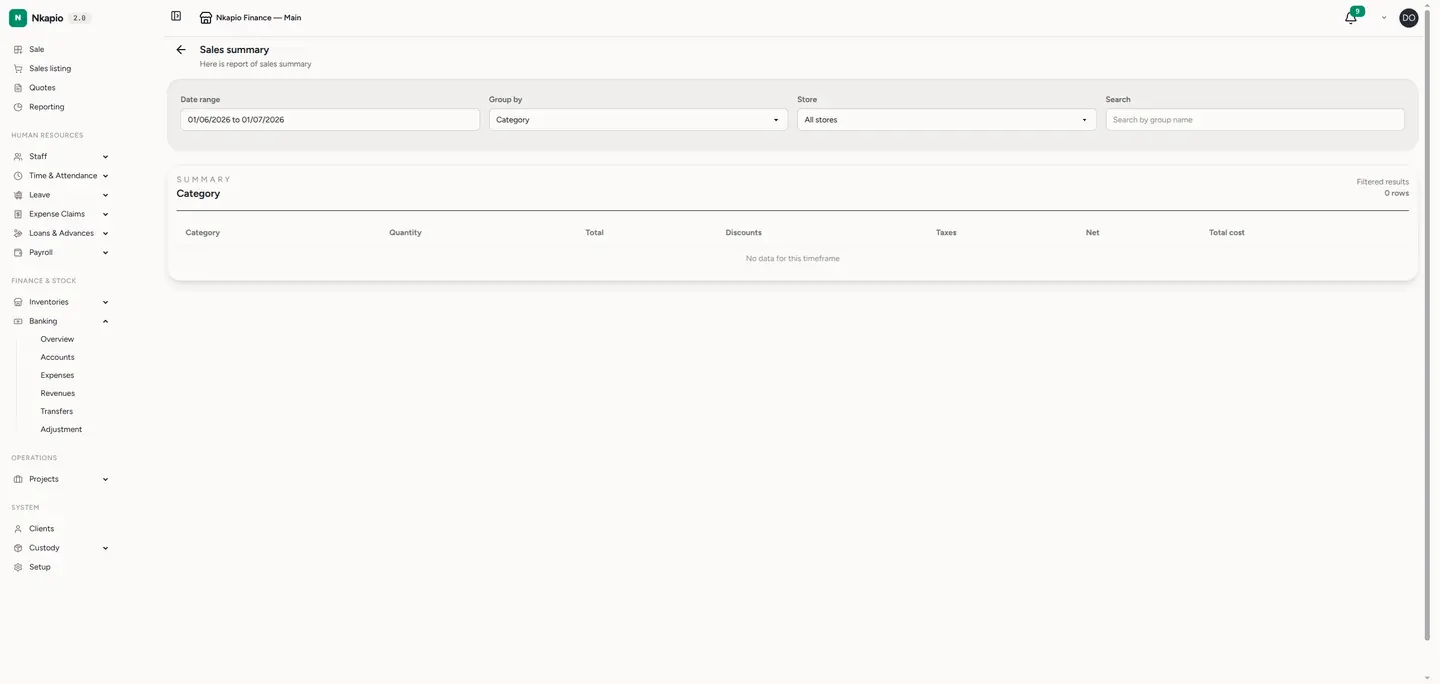
Open Sales summary from the Reports page. It opens on the current month by default. Set the date range, choose a store (or leave it on all stores), and use Group by to slice the numbers the way you think about the business — by category, product, brand, store, client or cashier. You can also search the grouped rows by name. Each row shows Quantity, Total, Discounts, Taxes, Net and Total cost, with a bold total line across the top so the period total is always in view.
Step 2 — Read the revenue trend
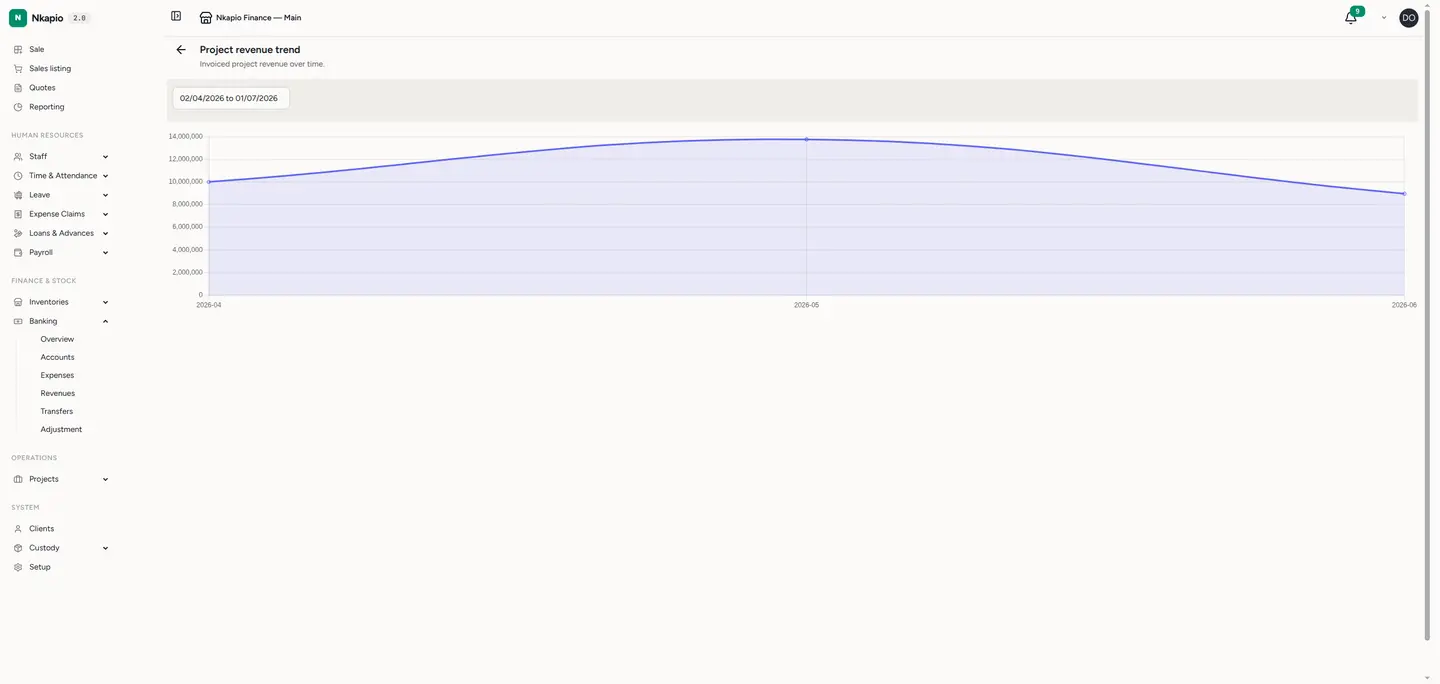
Switch to the revenue trend view to see income laid out over time. Read across the columns — items sold, gross sales, discounts, tax, net sales and margin — to spot busy and quiet stretches at a glance and compare one month against another. It's the fastest way to answer "are we growing, and by how much?".
Step 3 — Check profitability
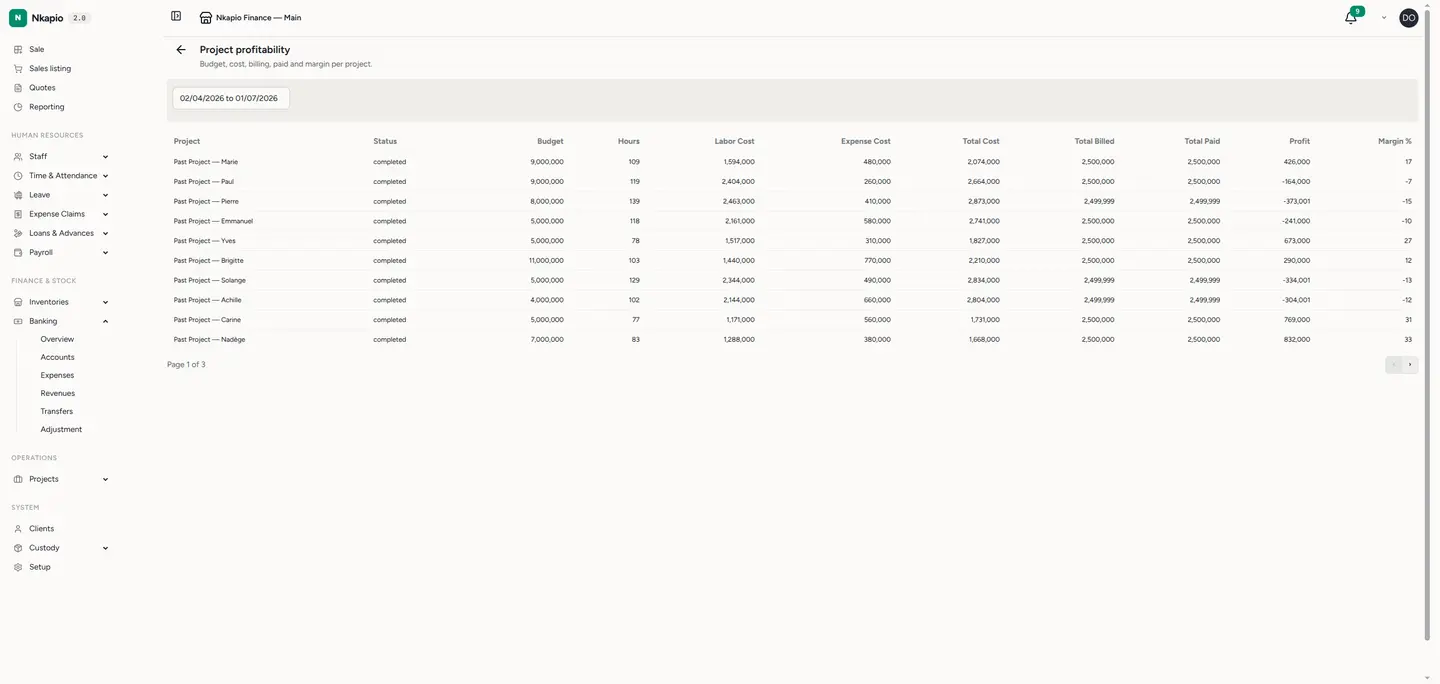
Open the profitability view to weigh revenue against the cost of what you sold. The gap between the money that came in and the cost of the goods or services behind it is your margin. This tells you which offerings actually make you money — not just which ones sell the most — so you can price and promote with the full picture in hand.
Other sales & revenue reports
Beyond these three, the Sales section carries a few more views, shown according to what your business does:
- Services sales and Services by staff — how much each service brought in, and which team member performed it (available when Bookings is on).
- Gift card sales and redemptions — what was loaded onto gift cards and what has since been redeemed.
- Finances summary — gross sales, discount and tax totals alongside a breakdown by payment type, period by period.
- Outstanding sales (AR) — every unpaid or part-paid invoice with the balance still due, so you can chase what's owed.
Tip: the summary always opens on the current month. Widen the date range before comparing across quarters, and set a single store when you want a clean per-branch figure.
Frequently asked questions
Why don't my report totals match my bank balance? These reports count invoiced sales and the payments made against them — not money you enter directly in Banking. Deposits, transfers and "other revenue" recorded outside a sale won't show up here.
A sale is missing from the totals. Check the date range and store filter first: the summary opens on the current month and, when a store is selected, hides sales rung up elsewhere. Archived and refunded invoices are also left out by design.
Can I export these reports? The sales and revenue reports are on-screen views. When you need figures to hand to an accountant, use the dedicated accounting statements, which have their own PDF and CSV exports.