If you run a clinic, this is where the clinical side of the business turns into numbers. Open the reports under Reports (the Clinical section) and use the period buttons — Today, This week / month, Last month, This quarter, This year, or a custom range — at the top of each. Every report exports to CSV.
Before you start. The Clinical section only appears once the diagnostics module is turned on for your clinic, and you need the manage clinical reports permission — Owners have it by default; other roles need it granted. The Inpatient report additionally requires the inpatient module to be enabled.
Patient flow
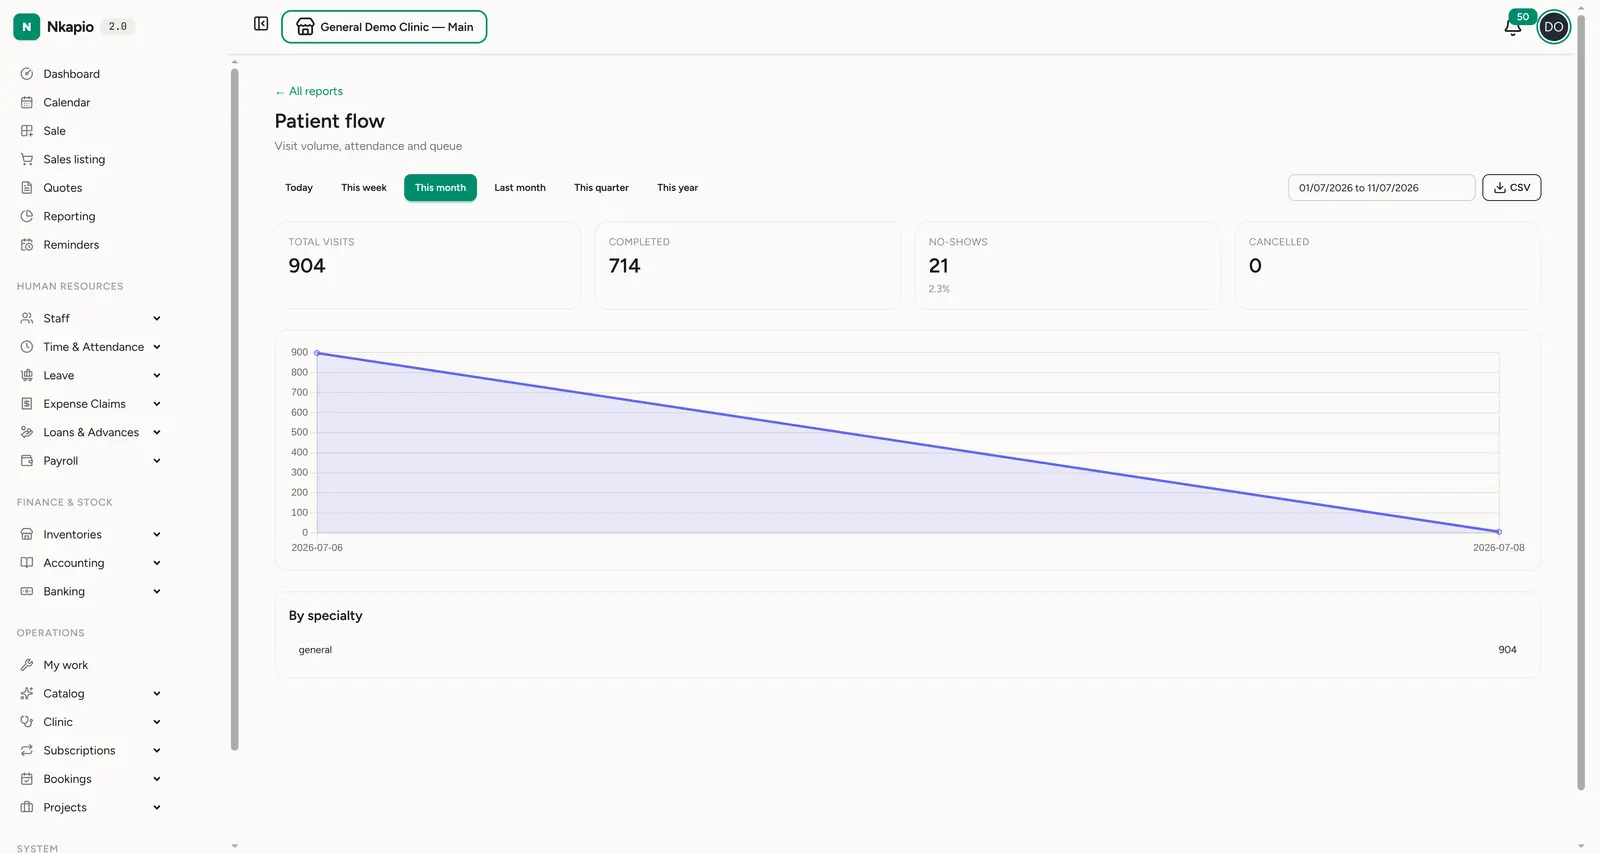
Reports → Clinical → Patient flow (/reports/clinical/overview) is the
attendance dashboard: total visits, completed, no-shows (with rate)
and cancelled, plus a breakdown by specialty. It's the fastest read on
how busy the clinic is and how many booked patients actually show up.
Clinical revenue
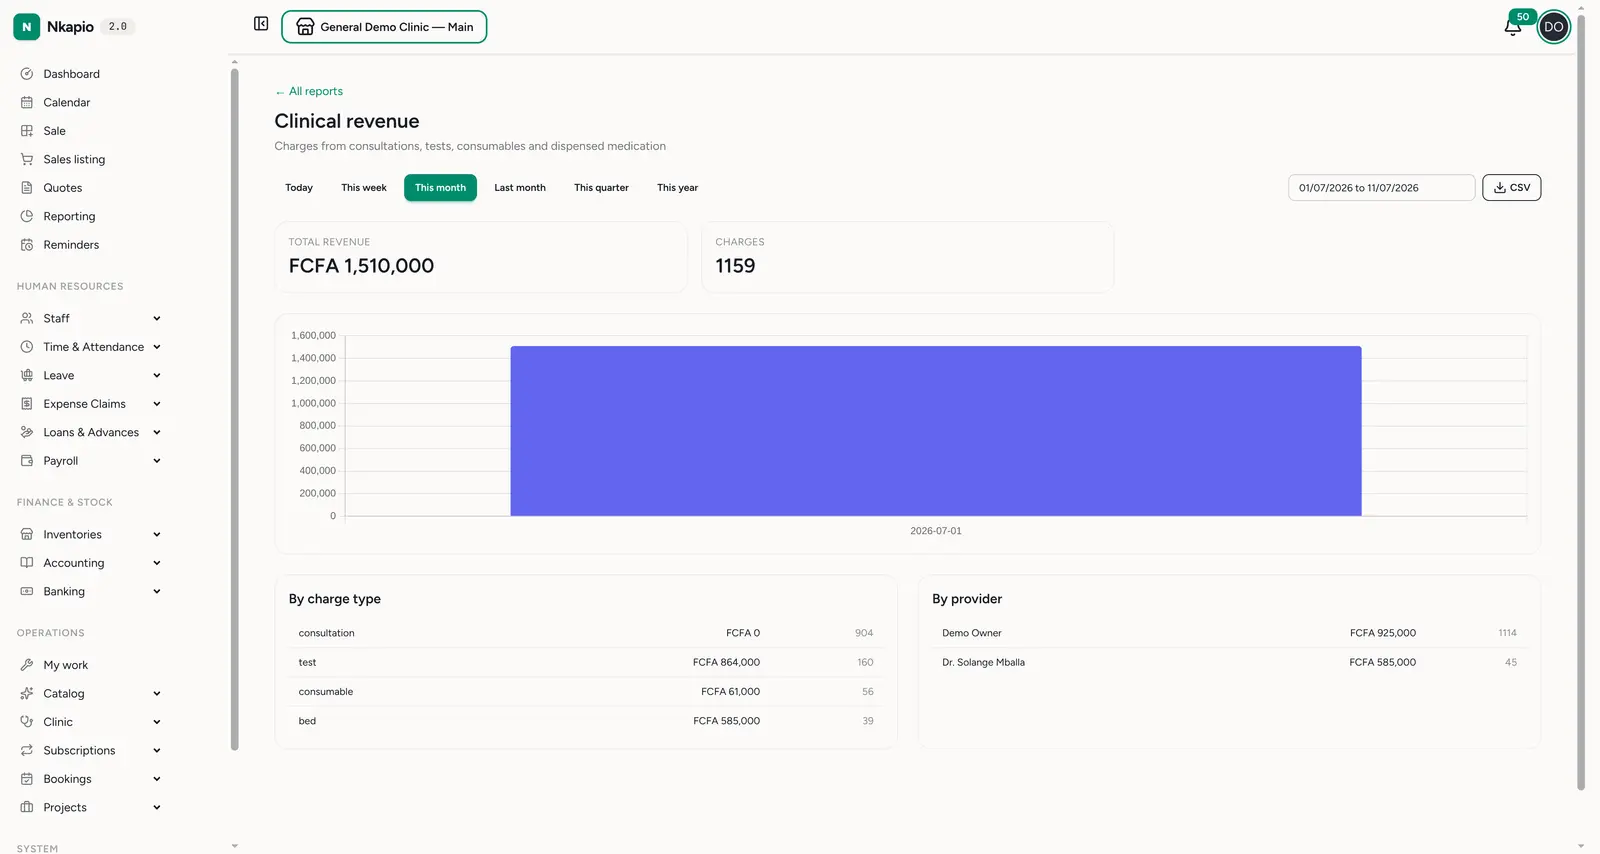
Reports → Clinical → Clinical revenue (/reports/clinical/revenue) totals
the charges from consultations, tests, consumables and dispensed medication. The
headline total revenue and charge count sit above a trend chart, then two
tables split it by charge type and by provider — so you can see whether
the money comes from consults, lab tests, beds or pharmacy, and who generated it.
Insurance claims
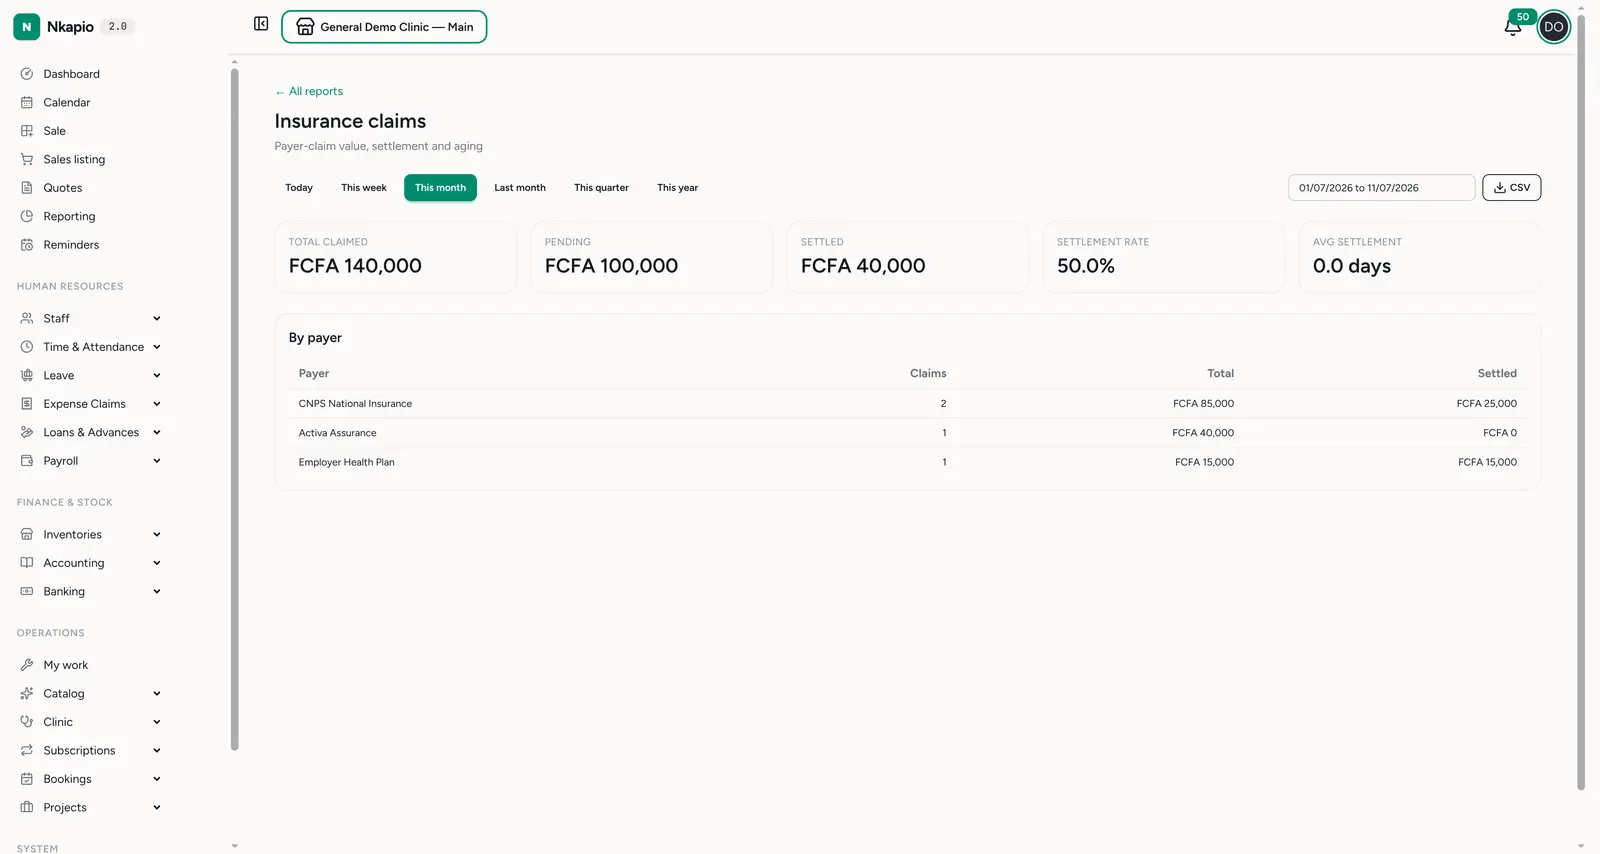
Reports → Clinical → Insurance claims (/reports/clinical/insurance) tracks
the payer side: total claimed, pending, settled, the settlement
rate and average days to settle, with a breakdown by payer. Use it to
chase slow payers and see how much cash is tied up in claims.
The rest of the section
Three more reports round out the Clinical section:
- Provider productivity (
/reports/clinical/providers) — case load and revenue per clinician. - Clinical activity (
/reports/clinical/activity) — what's being done: diagnoses, prescriptions, lab orders, referrals and treatment plans. - Inpatient (
/reports/clinical/inpatient) — bed occupancy and admissions, when the inpatient module is on.
Tips
- Watch the no-show rate — it's money and clinician time lost; reminders are the usual fix.
- Reconcile revenue with insurance — a big pending-claims balance against strong clinical revenue means cash is stuck at the payers.
- Compare periods — the period buttons make month-over-month and quarter-over-quarter comparison a one-click read.