These reports give you the people side of the business alongside a deeper operational view. The HR overview answers "how is my team doing right now?" in a single screen, while progressive analytics breaks down the economics of your repair jobs — margins, turnaround, and who is doing the work. Managers and owners tend to live in the HR overview day to day; anyone running a repair operation leans on progressive analytics to price and staff jobs better.
You'll find them under Reporting → HR and Reporting → Analytics.
HR overview
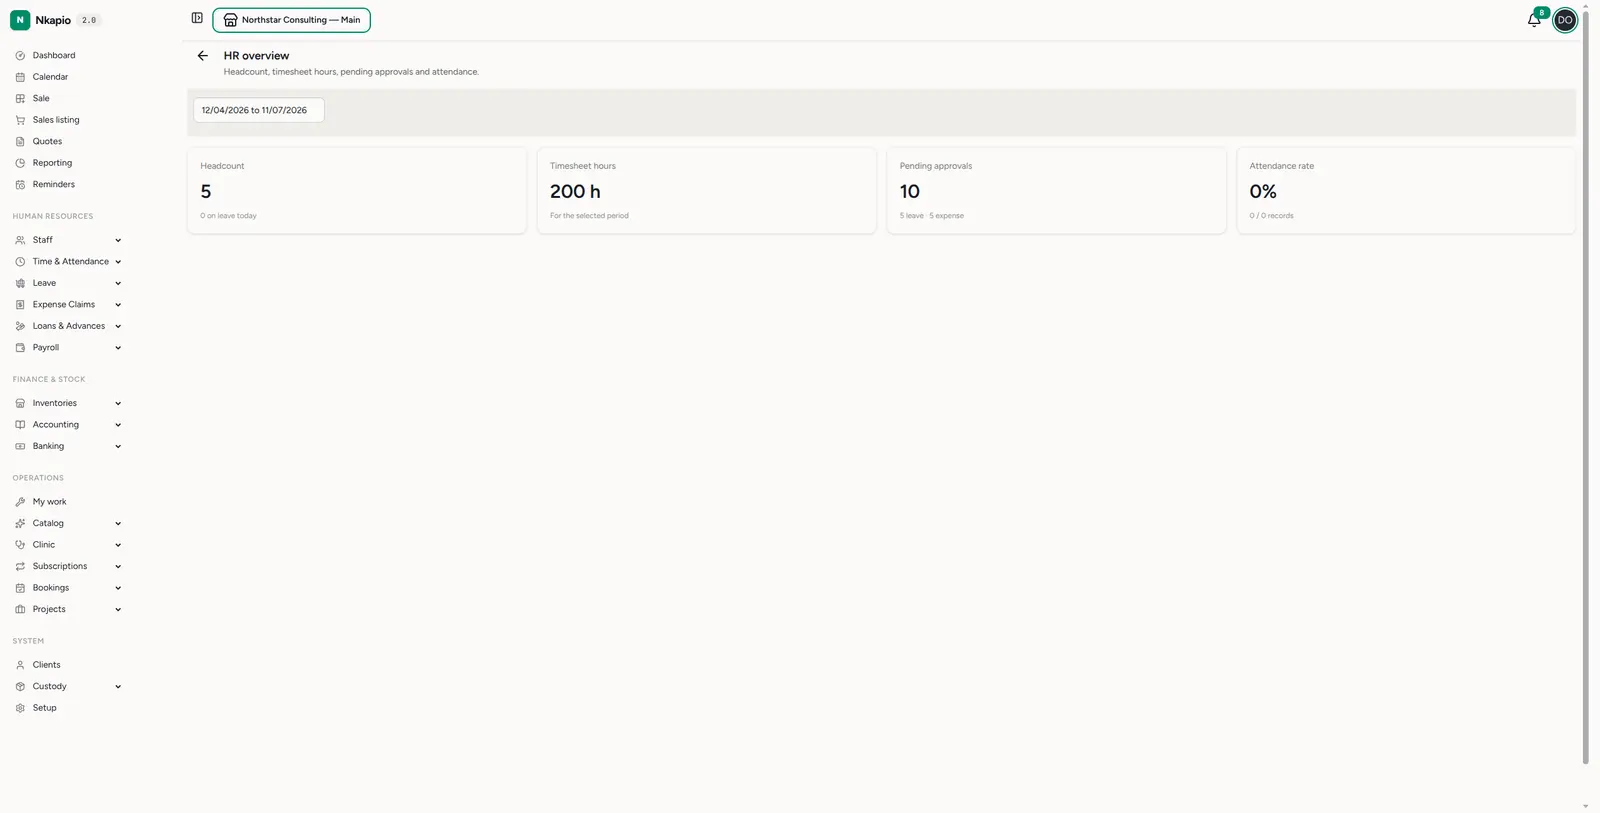
Reports → HR → Overview (/reports/hr/overview) is your workforce snapshot
for a chosen period. It pulls four numbers together into one glance instead of
four separate tables:
- Headcount — the number of active employees, with a note of how many are on approved leave today.
- Timesheet hours — total hours logged across all timesheet entries in the selected range.
- Pending approvals — submitted leave requests plus pending expense claims still waiting on a decision, shown as a combined figure with the split underneath.
- Attendance rate — the share of attendance records marked present over the period, with the underlying present-of-total count.
The page opens on the last 90 days by default. Use the date range picker at the top to narrow to a single month or stretch it out, and the four tiles recalculate together — which makes month-over-month comparison quick.
Progressive analytics
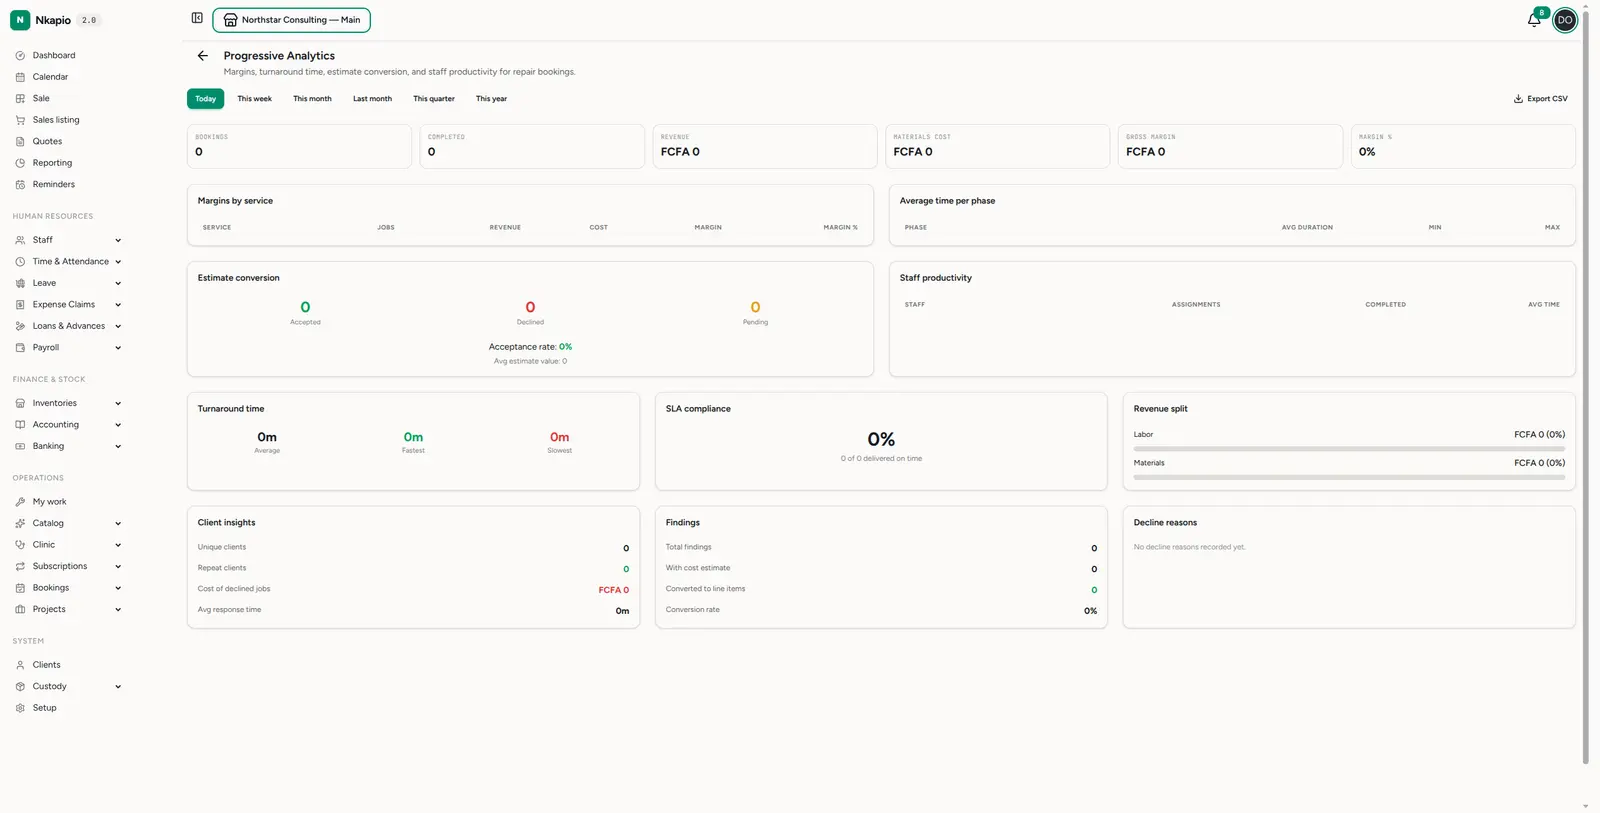
Reports → Progressive analytics (/reports/progressive-analytics) goes
deeper on your repair (progressive-workflow) bookings. Pick a range with the
buttons along the top — today, this week, this month, last month, this quarter or
this year — and the whole page reworks around it. A row of KPIs (bookings,
completed, revenue, materials cost, gross margin and margin %) sits above several
breakdowns:
- Margins by service — revenue, cost and margin for each service, so you can see which jobs actually make money.
- Average time per phase and turnaround time — how long work sits at each stage, and the fastest, slowest and average end-to-end time.
- Estimate conversion — accepted, declined and pending estimates, the acceptance rate, the average estimate value and how quickly you respond.
- Staff productivity — assignments, completions and average time per person.
- SLA compliance, revenue split (labor vs. materials), client insights, findings and top decline reasons round out the picture.
Use the Export CSV button (top right) to pull the margins-by-service table into a spreadsheet.
Before you rely on these numbers
- HR module + permission. The HR overview only appears when the HR module is switched on for your business and your role carries the HR management permission. Progressive analytics is available to anyone who can view bookings.
- Data follows the workflow. The tiles stay empty until the underlying work actually happens — headcount needs employees on the payroll, hours need submitted timesheets, approvals need leave and expense requests, and the attendance rate needs attendance records. Progressive analytics only counts bookings on the repair workflow, so a business that doesn't run repairs will see it empty.
Tips
- Clear pending approvals — a high pending-approvals count usually means payroll or leave balances are about to drift; act on it.
- Track attendance over time — a falling attendance rate is an early signal worth investigating.
- Compare periods — the date range makes month-over-month comparison the fastest way to see change.
- Watch thin margins — a service near the bottom of margins by service is worth re-pricing before it eats into the rest of the shop.