Beyond notes and prescriptions, the clinical workspace carries specialty charts — visual, tool-specific records tailored to how each practice documents care. A dentist charts individual teeth; an eye clinic tracks pressure and acuity over time; a physiotherapist maps pain sites on a body figure. These charts live alongside the patient's notes, vitals, diagnoses, and prescriptions, so everyone on the care team reads from a single record.
Each Nkapio clinic has one specialty — a dental practice is a dental practice, an eye clinic is an eye clinic — and that specialty decides which chart appears. Nkapio recognises general, dental, ophthalmology, physiotherapy, and veterinary clinics. Your administrator sets the specialty once for the whole clinic, and only the matching chart tab shows for everyone; you don't pick a chart per patient.
Open a patient from Clinic → Patients, then use the tabs across the top of their workspace — your specialty chart (Odontogram, Eye, or Body) alongside DICOM — to reach the chart you need.
Odontogram (dental)
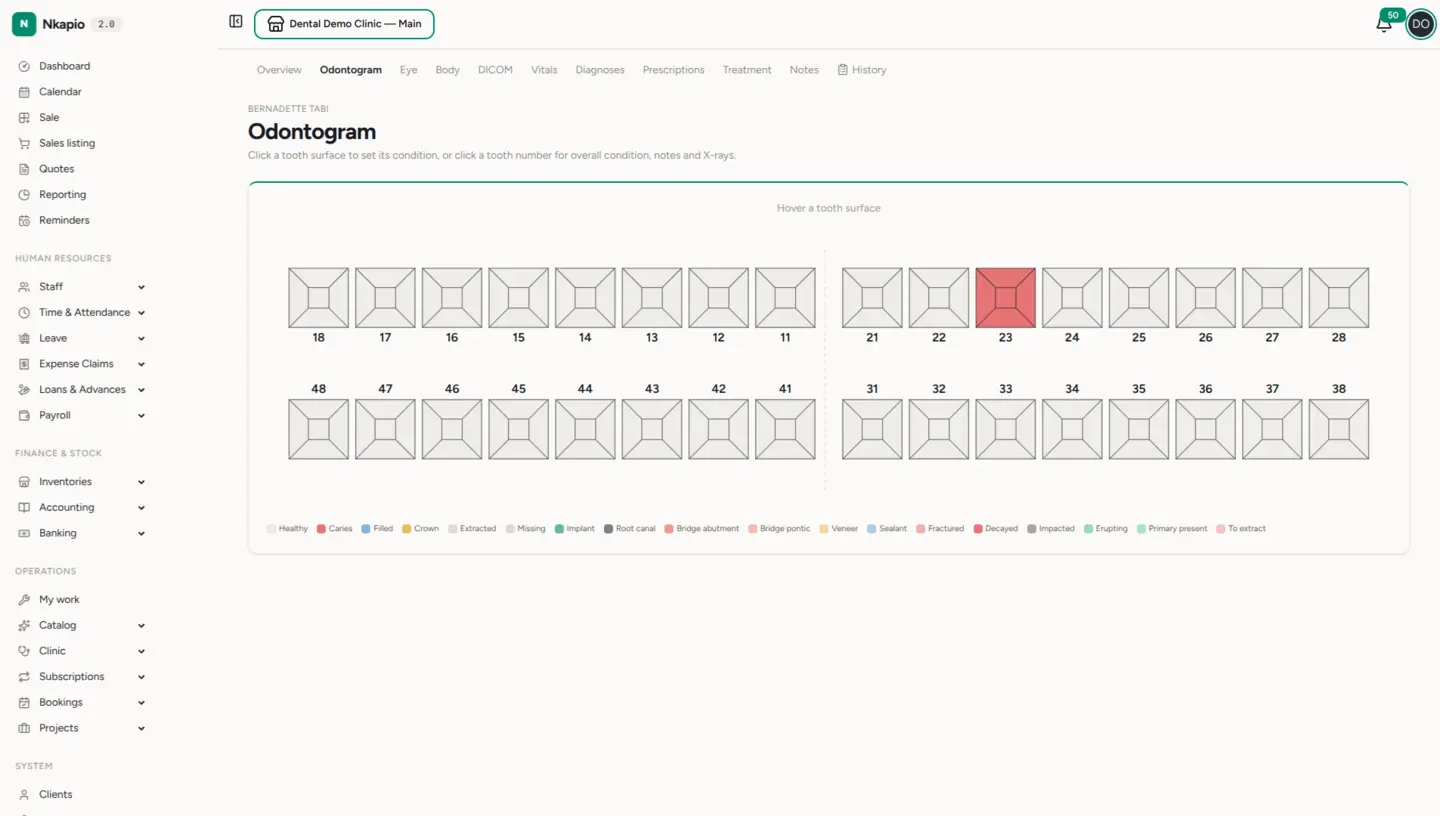
The Odontogram tab shows the full permanent dentition in FDI numbering. Click a tooth surface to set its condition, or click a tooth number to set the overall condition and add notes or X-rays. A colour legend along the bottom maps every state — healthy, caries, filled, crown, extracted, missing, implant, root canal, and more — so the chart reads at a glance.
Each tooth keeps a single running record: the overall condition, per-surface findings (mesial, distal, occlusal, buccal, lingual, incisal, cervical), free notes, and attached X-ray images. Because the record is per patient, the chart always reflects the mouth's current state, and each tooth carries its own history so you can trace how a tooth changed across visits.
Eye chart (ophthalmology)
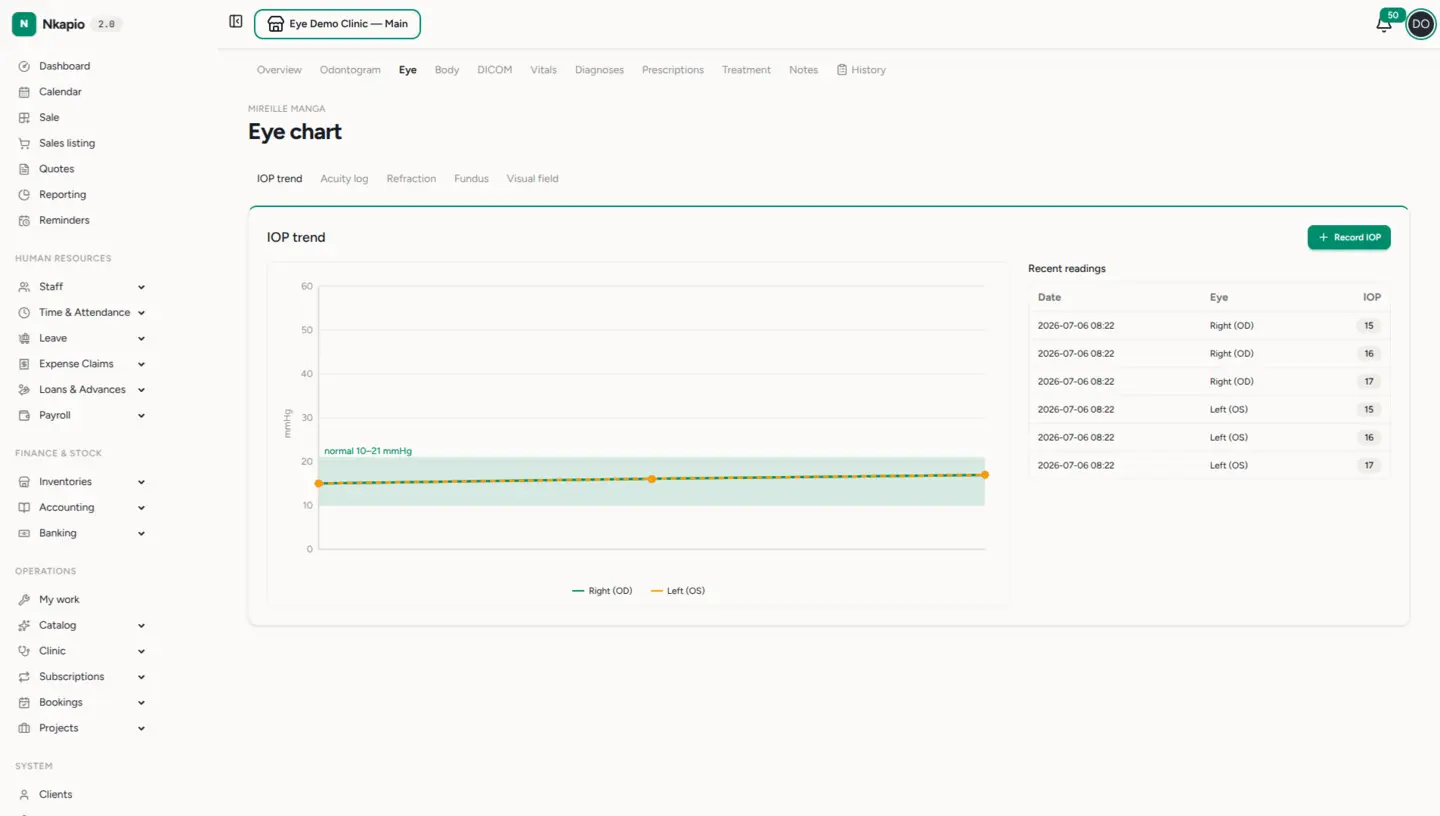
The Eye tab keeps ophthalmic measurements per eye (OD/OS). The IOP trend view plots intra-ocular pressure against the normal 10–21 mmHg band, with a Record IOP button and a list of recent readings. Further tabs cover the Acuity log, Refraction, Fundus, and Visual field.
Every entry is one measurement event, scoped to an eye and a kind — tonometry, visual acuity, refraction (sphere, cylinder, axis, add), slit lamp, fundus, visual field, or OCT. Because each reading is timestamped, the eye chart builds a proper time series: the IOP trend and acuity log plot successive visits, which is exactly what you need to follow glaucoma or a changing prescription.
Body chart (physiotherapy)
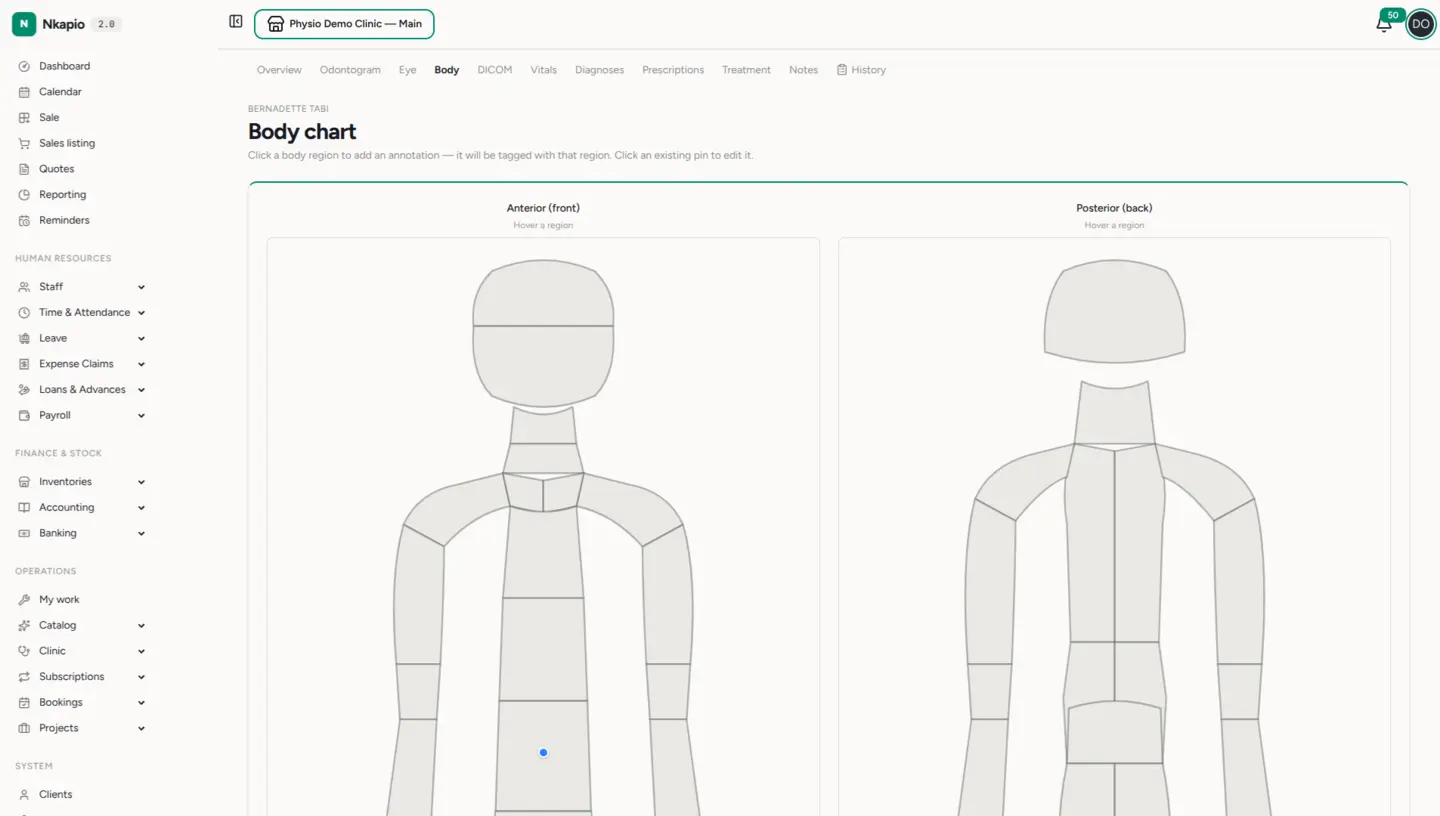
The Body tab shows anterior and posterior figures. Click a body region to drop an annotation — it's tagged with that region — and click an existing pin to edit it. It's ideal for tracking pain sites, injuries, and treatment areas over successive visits.
Each pin records what it marks — pain, injury, lesion, swelling, scar, and so on — with an optional pain rating, notes, and images. When a problem clears, you can mark that pin resolved rather than delete it, so the body chart keeps a faithful before-and-after picture of the patient's progress.
DICOM imaging
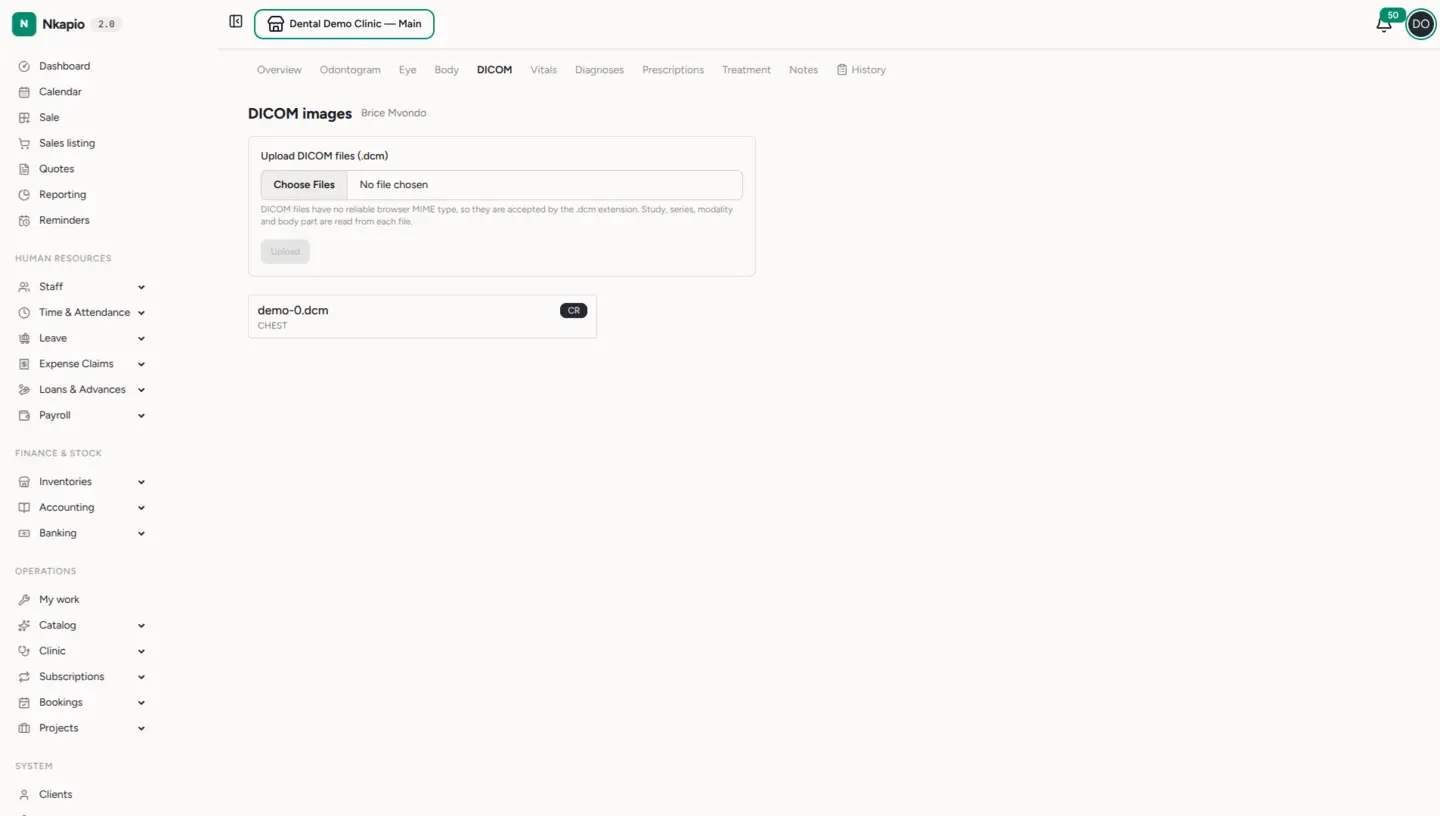
The DICOM tab accepts radiology studies. Upload .dcm files — study, series,
modality, and body part are read from each file — and they appear in the patient's
imaging list (for example a CR chest study), available to every clinician on
the record.
Unlike the three charts above, DICOM isn't tied to a single specialty: any clinic running the diagnostics module can attach and review imaging, whatever its practice type.
Prerequisites & tips
- The chart follows the specialty. The Odontogram tab appears only for dental clinics, Eye only for ophthalmology, and Body only for physiotherapy. General and veterinary clinics see the shared clinical tabs and DICOM, but no dedicated specialty chart.
- Access is gated two ways. A chart tab shows only when the diagnostics module is on and you hold read permission on that chart; recording findings needs write permission, and you must be on the patient's care team (or hold the view-all-patients right).
- Record during a visit. Open a chart from within an active visit and new findings are stamped to that visit — a banner confirms you're recording for the current encounter — so the chart and the visit record stay in step.
- Don't see your chart? Check with your administrator that the clinic's specialty is set correctly; the specialty is exclusive, so switching it changes which chart tab everyone sees.