These reports answer three stock questions: what do I have?, what did it cost me to deliver services?, and when will I run out? Open them under Reports — the Inventory section (needs the inventory feature) and the Consumables section (needs bookings, since consumables are used during services). You also need a role with reporting access — the Reports area is permission-gated, so if a section doesn't appear, ask an owner to grant it.
Stock on hand
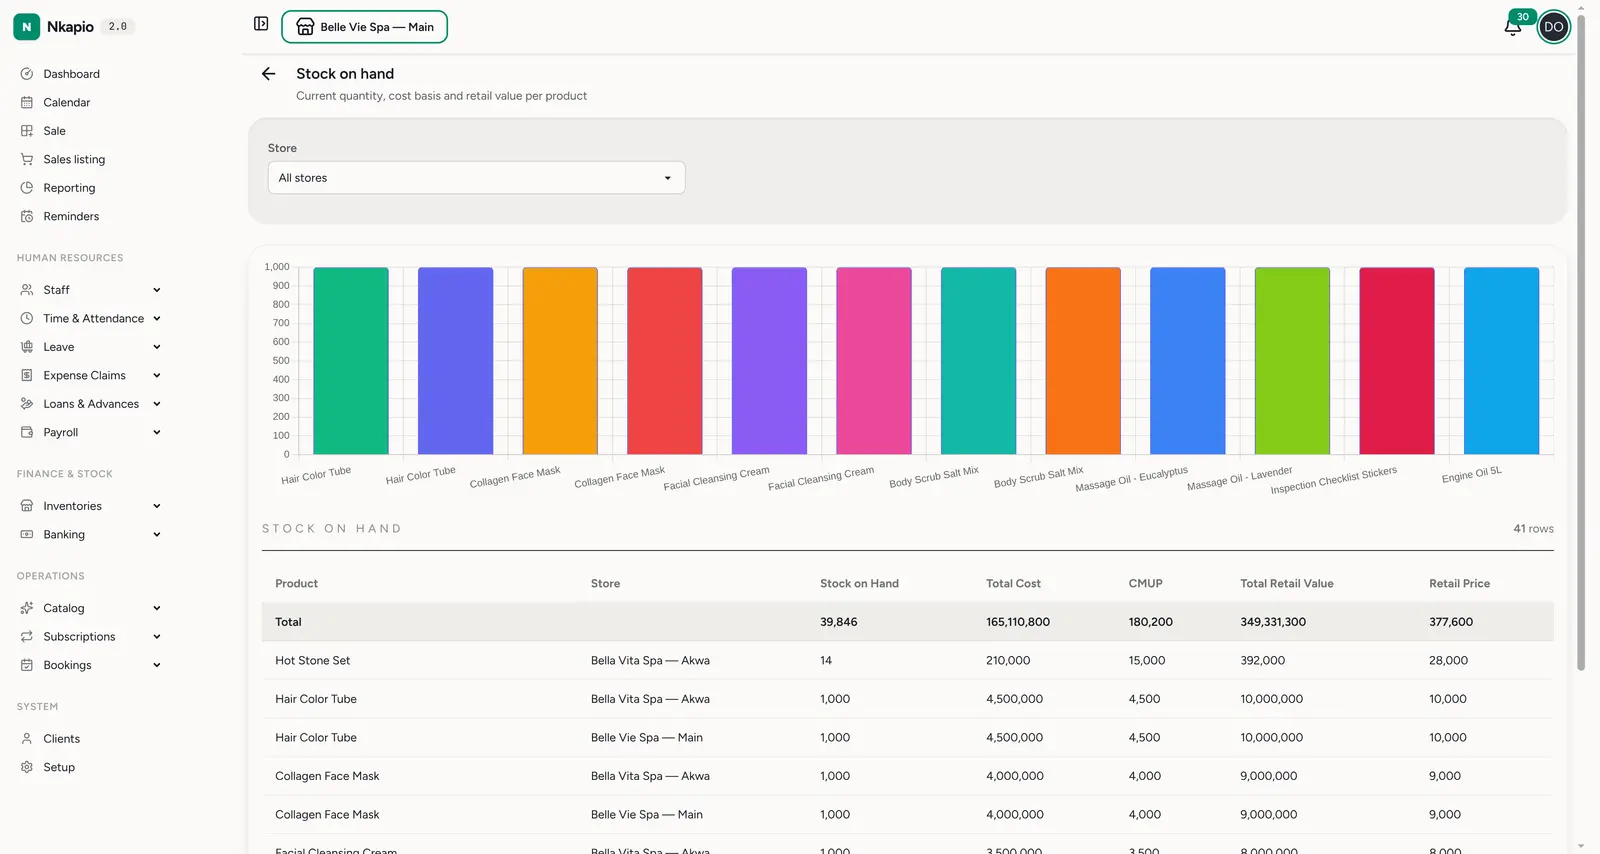
Reports → Inventory → Stock on hand (/reports/inventories/stock_on_hand) lists
every variant with its current quantity, so you can see your holdings at a glance
and spot what's low. Use the Store selector to scope it to one location. The
same section also offers Out of stock and Stock turnover, and — when the
matching modules are on — expiry/FEFO and returnable-packaging stock.
Alongside these, the Products and Purchasing sections (also under the inventory feature) cover the sell side (top products, sales by category / brand / customer, revenue trend) and the buy side (purchases by supplier and by product).
Consumable COGS
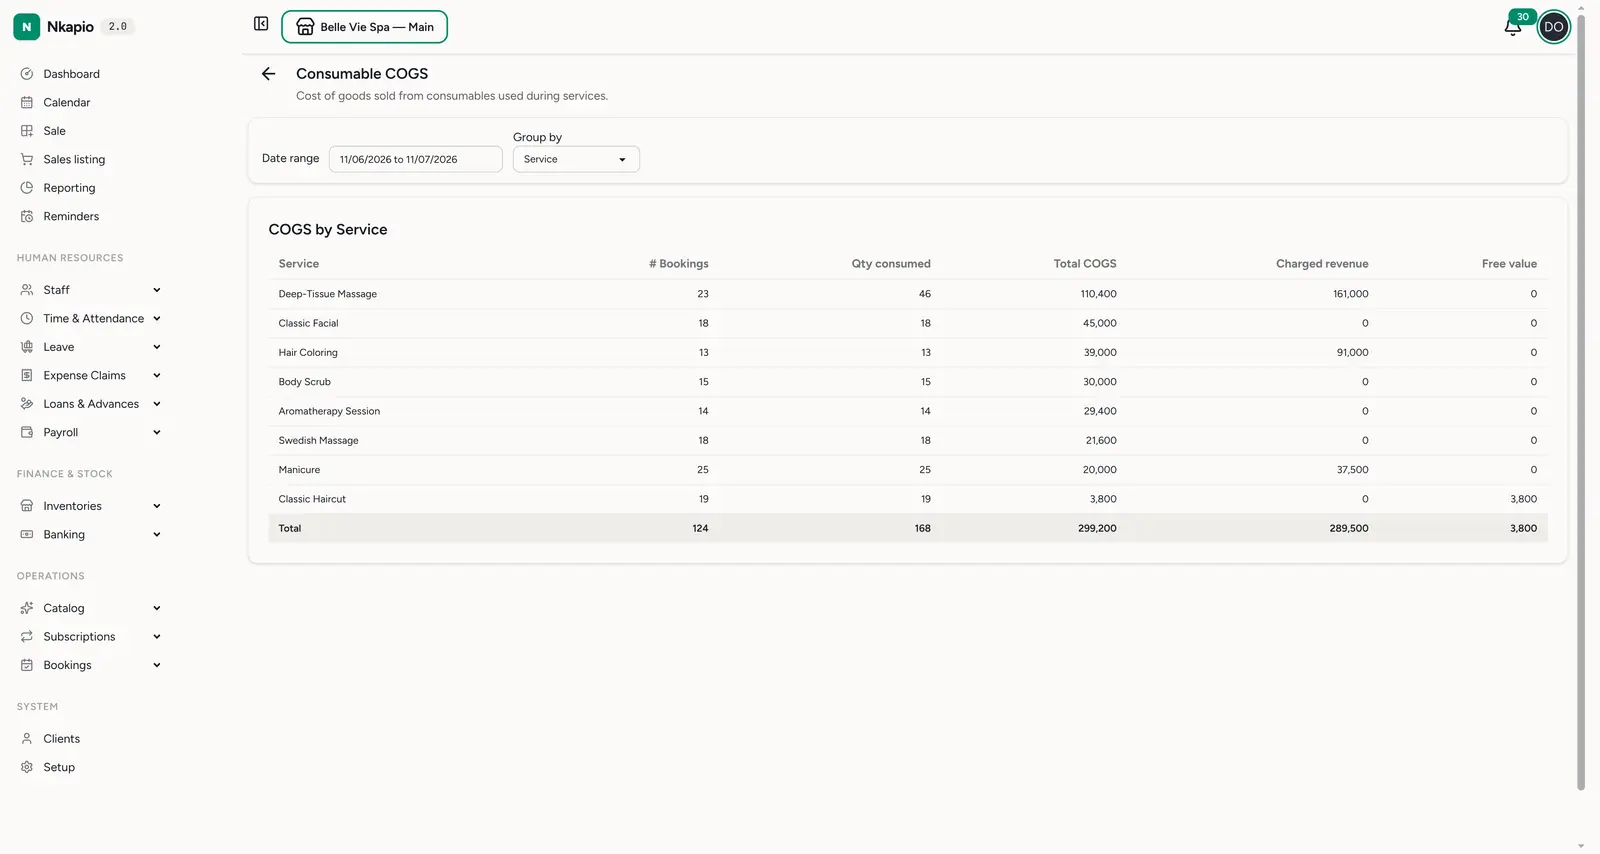
Reports → Consumables → COGS (/reports/consumables/cogs) shows the cost of
the consumables used up while delivering services — the true cost of goods sold
behind each booking. Pick a date range and group by service, package,
store or staff. Each row shows the number of bookings, quantity consumed, total
COGS, the revenue you charged, and any free value (consumables given away at
no charge). The total row ties it all together.
Stock burn & forecast
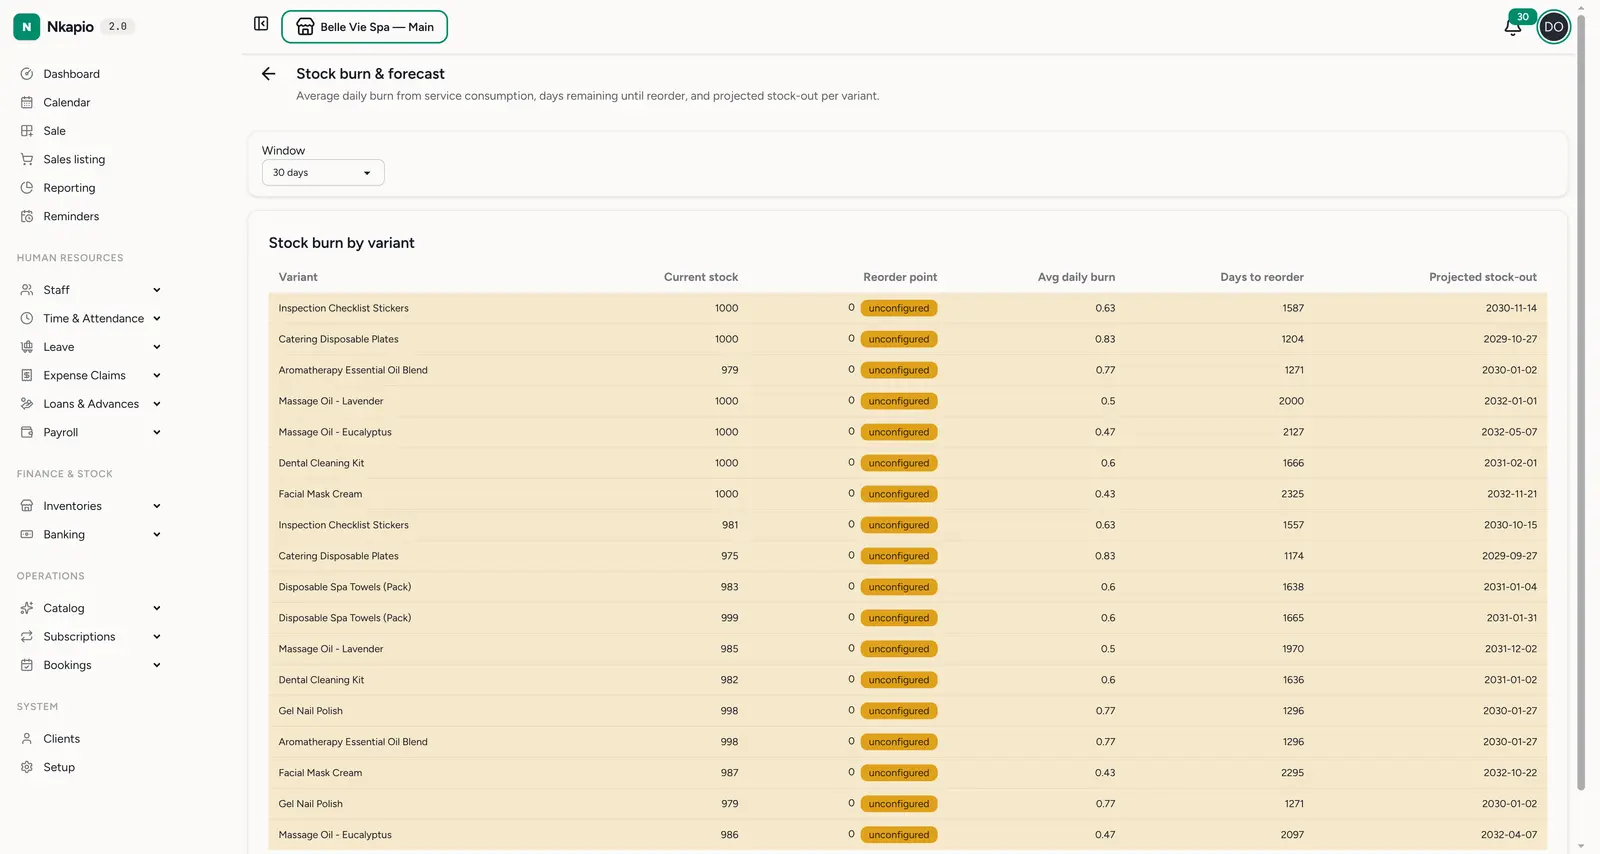
Reports → Consumables → Stock burn (/reports/consumables/stock-burn)
projects when you'll run out. For each variant it shows current stock, the
reorder point, the average daily burn from service consumption, the days
to reorder, and a projected stock-out date. Switch the Window (30 / 60
/ 90 days) to base the burn rate on a longer or shorter history.
Tips
- Set reorder points — the forecast is far more useful once each variant has a reorder point; unconfigured variants are flagged and can't warn you early.
- Empty stock-burn rows? — the forecast only lists variants actually consumed by services in the chosen window, so a variant you haven't used recently won't appear until it's logged against a booking.
- Watch free value — consumables given away at no charge are a silent cost; if it climbs, tighten how they're logged.
- Group COGS by staff — it reveals who's heavy-handed with supplies and where a little coaching pays for itself.